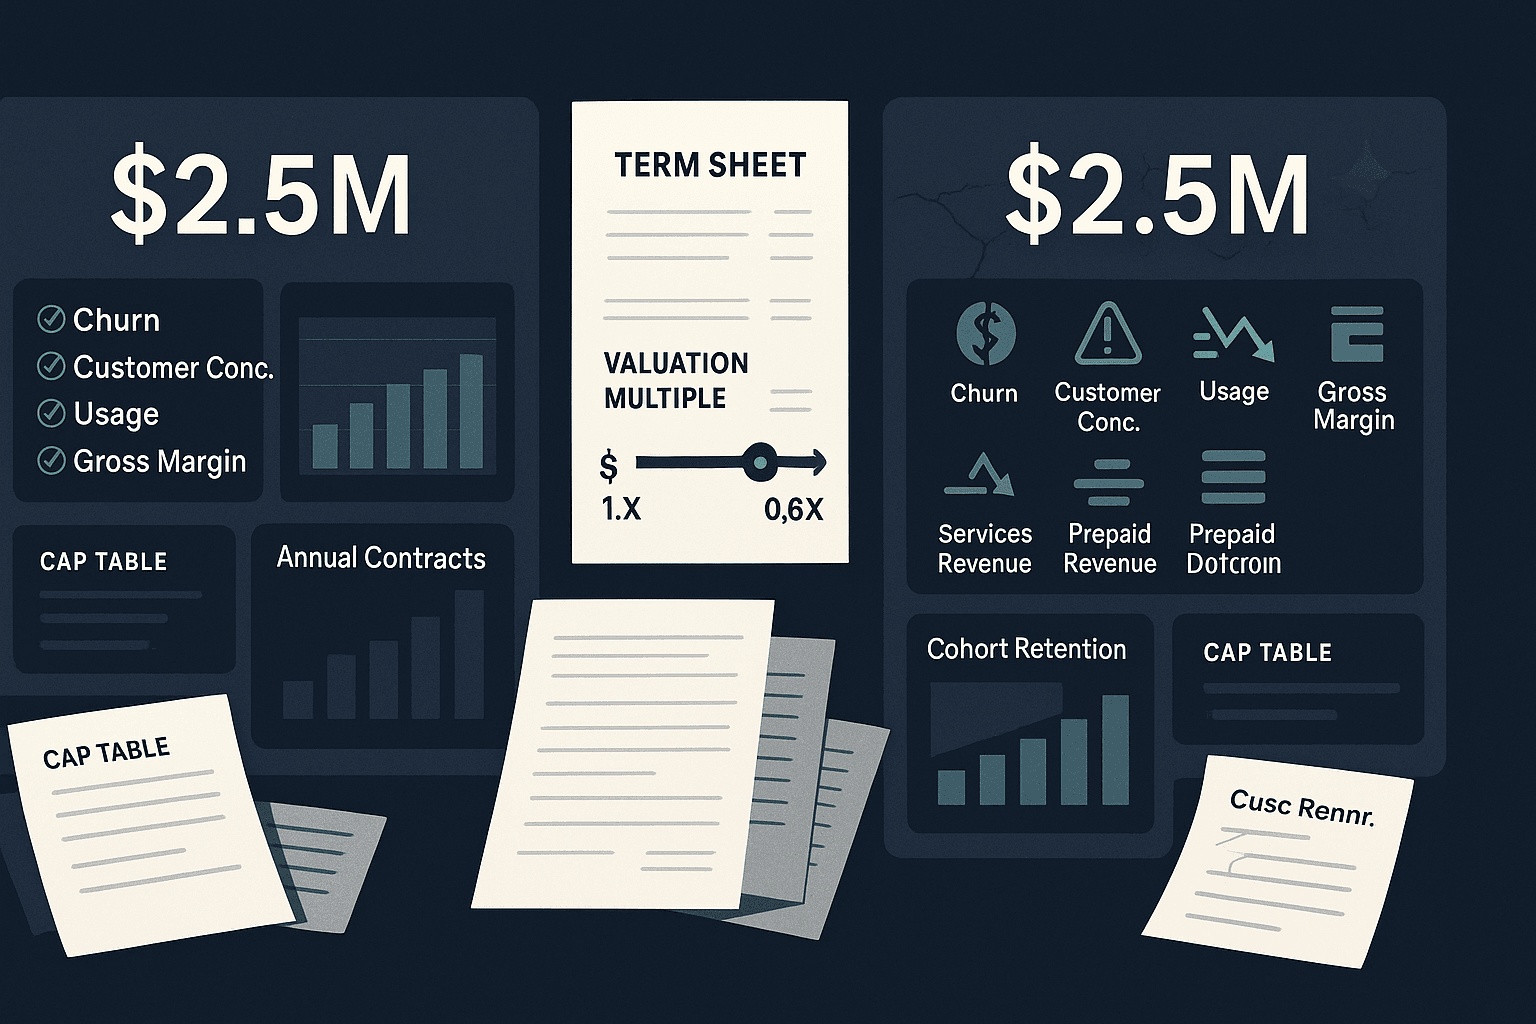
Why VCs quietly discount your revenue multiple long before the term sheet, which ARR quality signals they check, and how to prepare your numbers.
Two weeks later the term sheet comes in at a number that implies 7.5x.
Nothing dramatic happened in between. No customer churn bomb. No missed quarter. No scandal in diligence. Just a quiet, systematic repricing of what that ARR is actually worth.
This is one of the least discussed parts of venture fundraising: investors rarely value headline ARR. They value ARR after an internal quality haircut.
The haircut usually does not appear as a line item in the term sheet. Nobody writes, “We are docking 1.5 turns because your onboarding team is doing half the work the product should do,” or “We are cutting 2 turns because 28% of your ARR is really usage that will disappear in a downturn.” Instead, the investor smiles, says the market is selective, references comparables, and gives you a price that feels vaguely disappointing but hard to argue with.
That is because the real underwriting happened several layers below the top-line number.
The problem: ARR is not one thing
Founders often talk about ARR as if it were a single standardized asset. It is not. A dollar of ARR can be radically different from another dollar of ARR depending on what has to be true for it to recur, expand, and convert into durable free cash flow.
At early and growth stages, VCs are not buying current earnings. They are buying the belief that current revenue is the leading indicator of future revenue scale and eventual profit. The more fragile, noisy, or labor-dependent that revenue is, the less investors trust the headline number as a predictor.
This is why two startups can each report $5 million ARR and still deserve wildly different valuations.
Company A:
Company B:
These are not the same businesses. Yet many founders pitch them as though they are.
Investors do not.
They decompose ARR quality long before they talk valuation. In many firms, the pricing discussion starts only after a mental normalization process:
That is the ARR quality haircut.
Why current founder approaches fail
Most founders make one of three mistakes.
1. They treat all ARR as equivalent
This is the most common failure. A pitch deck says $6 million ARR and implies that every dollar should receive the same multiple. But investors immediately ask:
If the answers are muddy, the multiple comes down.
2. They optimize presentation rather than quality
Sophisticated investors can smell a revenue-quality cover-up fast. Typical examples:
You might win a few extra minutes in the first meeting. You will lose turns of valuation in diligence.
3. They argue comps without adjusting for the reasons comps are expensive
Founders love quoting public SaaS multiples or recent private financings. But premium multiples attach to revenue with specific properties: high margin, strong retention, low concentration, clear product dependence, predictable expansion, and clean accounting treatment.
If your company lacks those properties, the comp is irrelevant.
A 10x company is not a company with 10x ARR. It is a company whose ARR deserves 10x.
The core insight: VCs often create a “shadow ARR” before they value you
Here is the useful way to think about this: the investor is often not really valuing your reported ARR. They are valuing a shadow ARR number adjusted for quality.
The exact spreadsheet differs by firm, but the logic is consistent. Investors implicitly ask:
Once you see fundraising this way, term sheet outcomes make much more sense.
A practical way to model it is to separate two effects:
Effect 1: ARR normalization
Some revenue is removed, reclassified, or discounted before a multiple is even applied.
Effect 2: Multiple compression
The remaining revenue gets a lower multiple because its characteristics imply weaker future cash generation or higher risk.
That means founders can get hit twice:
That double hit is why the haircut feels brutal.
A valuation example: same ARR, radically different price
Let’s compare two companies, each reporting $8 million ARR and raising a Series A extension or Series B.
Company Clean
Reported ARR: $8.0 million
Investor view:
Assume market clearing multiple: 9.5x forward ARR
Forward ARR in 12 months: $12 million
Indicative pre-money: $114 million
Company Messy
Reported ARR: $8.0 million
Investor does not simply apply the same 9.5x multiple to $8 million. They do something more like this.
#### Step 1: Normalize ARR
Start with $8.0 million reported ARR.
Shadow ARR after normalization:
$8.0 million - $0.8 million - $0.6 million - $0.2 million - $0.36 million = $6.04 million
Already, the investor is not really valuing $8 million. They are valuing something closer to $6 million.
#### Step 2: Compress the multiple
Now they ask whether the normalized revenue deserves a premium or discount multiple.
Negative factors:
Instead of 9.5x forward ARR, maybe this company gets 6.0x.
Assume forward shadow ARR grows to $8.5 million.
Indicative pre-money: 6.0 x $8.5 million = $51 million
That is not a modest difference. It is a radically different company in valuation terms.
Company Clean: $114 million pre
Company Messy: $51 million pre
Same headline ARR. More than 2x difference in price.
This is what founders miss when they talk only about top-line scale.
The hidden diligence questions that trigger multiple discounts
Investors rarely say “we’re applying an ARR quality haircut.” They ask operational questions. Each one is a proxy for a valuation adjustment.
1. Gross margin: Is this software or a disguised services business?
Low gross margin is not automatically fatal. But it forces a deeper question: why is margin low?
Possibilities include:
If gross margin is 55% to 65%, investors worry your growth will require proportionally more people or infrastructure than true software peers.
#### Simple gross margin haircut example
Startup X reports $10 million ARR at 85% gross margin.
Startup Y reports $10 million ARR at 60% gross margin.
If both trade at 8x on paper, that implies equal value. But they are not equal because each incremental dollar of ARR from Startup X contributes far more future gross profit.
Annual gross profit:
If you convert the valuation lens from revenue to gross profit:
Equivalent ARR multiple on Y: 5.64x
That is a 2.36-turn haircut driven largely by gross margin.
Founders hate this math because it feels punitive. Investors think it is basic underwriting.
2. Services contamination: How much revenue exists because humans compensate for product gaps?
Services revenue is not worthless. Sometimes it speeds adoption and increases account stickiness. But it generally deserves a lower multiple than subscription revenue because it is less scalable and often less recurring.
The key distinction is not just accounting classification. It is economic dependence.
If your enterprise deployments require six weeks of solution architecture, custom dashboard builds, workflow design, and data cleanup every time, the product may be less repeatable than the deck suggests.
#### Weighted multiple example
Suppose a company has:
A founder argues for 8x on the whole $8 million = $64 million.
An investor may underwrite it this way:
Implied enterprise value = $54 million
That is effectively a blended multiple of 6.75x, not 8x.
Nothing exotic happened. The investor simply refused to pay software multiples on labor-heavy revenue.
3. Annual prepay distortion: Is cash collection being mistaken for revenue quality?
Founders often overstate the signaling value of annual prepay. Yes, prepaid annual contracts can indicate commitment. But they can also hide issues:
Investors will ask:
If annual prepay is being used to make revenue look stickier than it is, the multiple falls.
#### Example
Suppose $1.5 million of your $6 million ARR comes from annual contracts sold at a 25% first-year discount, with a scheduled reset at renewal.
On paper, it looks like committed ARR.
In diligence, investors may ask whether the renewal will be:
If they believe only 70% of that prepaid base is renewal-secure, they mentally treat that bucket as closer to $1.05 million of high-quality ARR, not $1.5 million.
4. Churn cohort fragility: Are retention metrics hiding future problems?
NRR can lie by omission.
A company can post 112% NRR while still having serious revenue quality issues if expansion from a handful of large customers masks weak retention elsewhere.
What investors want to see is whether retention is durable across cohorts, segments, and time.
Questions that trigger concern:
#### Cohort example
Two companies each show 110% NRR.
Company A:
Company B:
Headline NRR is identical. Quality is not.
Investors pay for the probability that growth compounds. Company B’s metric may collapse if even two large expansions disappear.
That is multiple compression waiting to happen.
5. Ramped vs. productive seats: Is booked ARR actually deployed value?
This issue is especially common in seat-based enterprise SaaS.
Founders book a 2,000-seat contract and count the full annualized value in ARR. Technically correct under their convention. Economically incomplete.
If only 700 seats are deployed, 400 are active weekly, and the remaining 1,300 depend on rollout, training, change management, and executive sponsorship, investors will discount that ARR.
Not because the contract is fake, but because undeployed seats are less secure than productive seats.
#### Seat productivity example
A startup reports:
Investor follow-up:
Suppose analysis shows:
Now “contracted ARR” clearly contains a risk gradient. If a third of reported ARR sits in weakly deployed accounts, that portion gets discounted in valuation, whether anyone says so explicitly or not.
6. Usage-revenue volatility: Is your ARR budget-like or transaction-like?
Usage-based pricing can be fantastic when tied to customer value and embedded workflows. It can also produce some of the most overvalued and then violently repriced SaaS companies in a downturn.
The issue is not usage itself. It is volatility.
Investors ask:
A usage dollar tied to mission-critical API calls with stable baseline demand deserves a different multiple than a usage dollar tied to discretionary marketing spend or crypto trading volume.
#### Volatility math example
Company StableUsage:
Company VolatileUsage:
Both call themselves $6 million ARR businesses. Only one is likely to be valued like a true recurring revenue asset.
An investor might value StableUsage near blended SaaS multiples, but apply a materially lower multiple to VolatileUsage or haircut the usage bucket before applying any multiple.
7. Customer concentration: Is one account quietly determining your valuation?
Concentration risk is one of the cleanest hidden haircut triggers because the downside is obvious. If one customer is 15% to 20% of ARR, that account effectively sits inside the financing decision.
Investors do not just care about the current percentage. They care about dependency pathways:
#### Concentration discount example
A startup at $9 million ARR has one customer worth $1.8 million, or 20% of ARR.
If that contract is up for renewal in nine months and the customer required bespoke integrations and board-level attention, investors may mentally separate the business into:
Then they may apply:
Total = $63 million
Instead of 8x on the full amount = $72 million
That is a 12.5% valuation hit from one account. And that is before any broader multiple compression for concentration risk.
How this shows up in term sheet negotiations
The reason founders often feel blindsided is that valuation negotiations usually happen after weeks of “everything looks good” conversations. The investor is not lying. They may genuinely like the business. But internally they have already translated your company into a lower-quality revenue profile.
Here is what a hidden haircut negotiation often sounds like.
Founder:
“Peers at our scale are raising at 9x to 11x forward ARR.”
Investor:
“We agree those are good comps, but the market is drawing distinctions around efficiency and durability.”
Translation: your ARR does not deserve the comp set.
Founder:
“We’re at $5 million ARR growing 120%. That should command a premium.”
Investor:
“Growth is strong, but we’re spending time on margin structure, deployment maturity, and concentration.”
Translation: your headline growth is being discounted because the underlying revenue is lower quality.
Founder:
“Our NRR is 113%.”
Investor:
“Yes, though expansion appears concentrated and we want to understand the baseline renewal motion.”
Translation: we are not paying a premium for NRR we do not trust.
The dangerous founder response is to push harder on the headline numbers. The better response is to address the exact quality concern with evidence.
A practical cap table example: why the haircut matters more than founders think
Suppose you planned a $15 million round and expected a $90 million pre-money valuation based on market chatter. That implies a $105 million post-money, and you sell 14.3% of the company.
Now assume investor diligence applies an ARR quality haircut and offers $65 million pre.
Same $15 million primary round means:
That is not a cosmetic difference.
On a founder ownership stake of 40% pre-round:
Difference: 1.8 percentage points of the whole company lost in one round.
If the business later exits for $800 million, that 1.8% gap is worth $14.4 million.
This is why revenue quality is not an academic finance concept. It becomes founder wealth.
How founders should present ARR quality without over-optimizing the story
The answer is not to perform purity theater. Investors distrust polished-but-fragile narratives. The answer is to present a revenue-quality map that is honest, segmented, and decision-useful.
1. Break ARR into quality buckets upfront
Do not force investors to discover the segmentation themselves.
Show:
When founders disclose this clearly, they gain credibility and can control the interpretation.
2. Pair every risk factor with a mitigation trend
If 18% of revenue is usage-based, show the stability data.
If services are 20% of revenue, show the plan and progress to reduce them as a percentage over time.
If concentration exists, show diversification in pipeline and renewal visibility.
Investors accept imperfection. They punish surprise.
3. Use cohort evidence, not aggregate slogans
Do not just say “best-in-class retention.” Show:
This helps investors separate controllable pattern from anecdotal noise.
4. Distinguish booked ARR from productive ARR
If you sell seats, report activation and deployment curves. If you have usage revenue, report baseline committed spend versus variable overage. If you rely on annual contracts, show time-to-go-live and renewal outcomes.
The principle is simple: make economic reality visible.
5. Explain low gross margin in causal terms
“Gross margin is 64%” is a problem statement.
“Gross margin is 64% because onboarding is labor-heavy in year one, but cohorts above 12 months run at 78% and new product changes reduce implementation hours by 40%” is an underwriting argument.
VCs do not need perfection. They need believable operating leverage.
6. Don’t pretend messy revenue is pristine revenue
Some businesses are excellent despite mixed revenue profiles. Infrastructure, fintech, vertical SaaS with payments, data companies, and workflow platforms often blend subscription, usage, and services. That is fine.
But then your job is to help investors value each component correctly and show why the blended model is durable.
A credible blended story beats a fake pure-SaaS story every time.
A founder-friendly framework: run your own ARR quality haircut before the raise
Before fundraising, build the same shadow analysis investors will.
Start with reported ARR and ask:
Then create three views.
View 1: Reported ARR
The top-line number you use externally.
View 2: Normalized ARR
Reported ARR minus the portions likely to be discounted in diligence.
View 3: Weighted ARR value
Apply different internal multiples to each bucket.
Example:
Total implied value = $58.45 million
Blended multiple on $8.0 million reported ARR = 7.3x
That exercise will usually predict your real financing range better than generic market comps.
It will also tell you what operational fixes have the highest valuation leverage.
For example:
These are not just KPI improvements. They are multiple-expansion projects.
What not to do
A few hard opinions.
Don’t annualize unstable monthly spikes and call it traction
Investors will reverse-engineer it.
Don’t bury implementation revenue in ARR narratives
If humans are doing the work, expect the software multiple to drop.
Don’t hide weak deployment behind booked seat counts
Contracted is not the same as embedded.
Don’t weaponize NRR without segment context
One whale expanding is not a retention engine.
Don’t assume annual prepay equals high quality
Sometimes it is just discounted budget capture.
Don’t overfit your company to a clean SaaS comp if your model is mixed
You will lose credibility faster than you gain price.
The real takeaway
The venture market does not price ARR. It prices belief in the future cash-flow quality of ARR.
That belief gets shaped long before the term sheet through a quiet internal process of normalization and discounting. Gross margin, services contamination, annual prepay structure, churn cohort fragility, undeployed seats, usage volatility, and customer concentration all change what your revenue is worth.
This is why founders with the same headline ARR can get radically different valuations. One is selling a clean, durable, scalable revenue asset. The other is selling a noisier bundle of contracts, labor, concentration, and optimism.
The fix is not spin. It is revenue-quality literacy.
If you understand the haircut categories before investors do, you can do three things better:
The best founders do not ask, “What multiple are companies getting?”
They ask, “What in our revenue base causes investors to trust or distrust the next dollar?”
That is the question behind the term sheet, whether anyone says it out loud or not.
RaiseSimpli Team
Author