Liquidation Stacks: Higher Valuation, Worse Exit
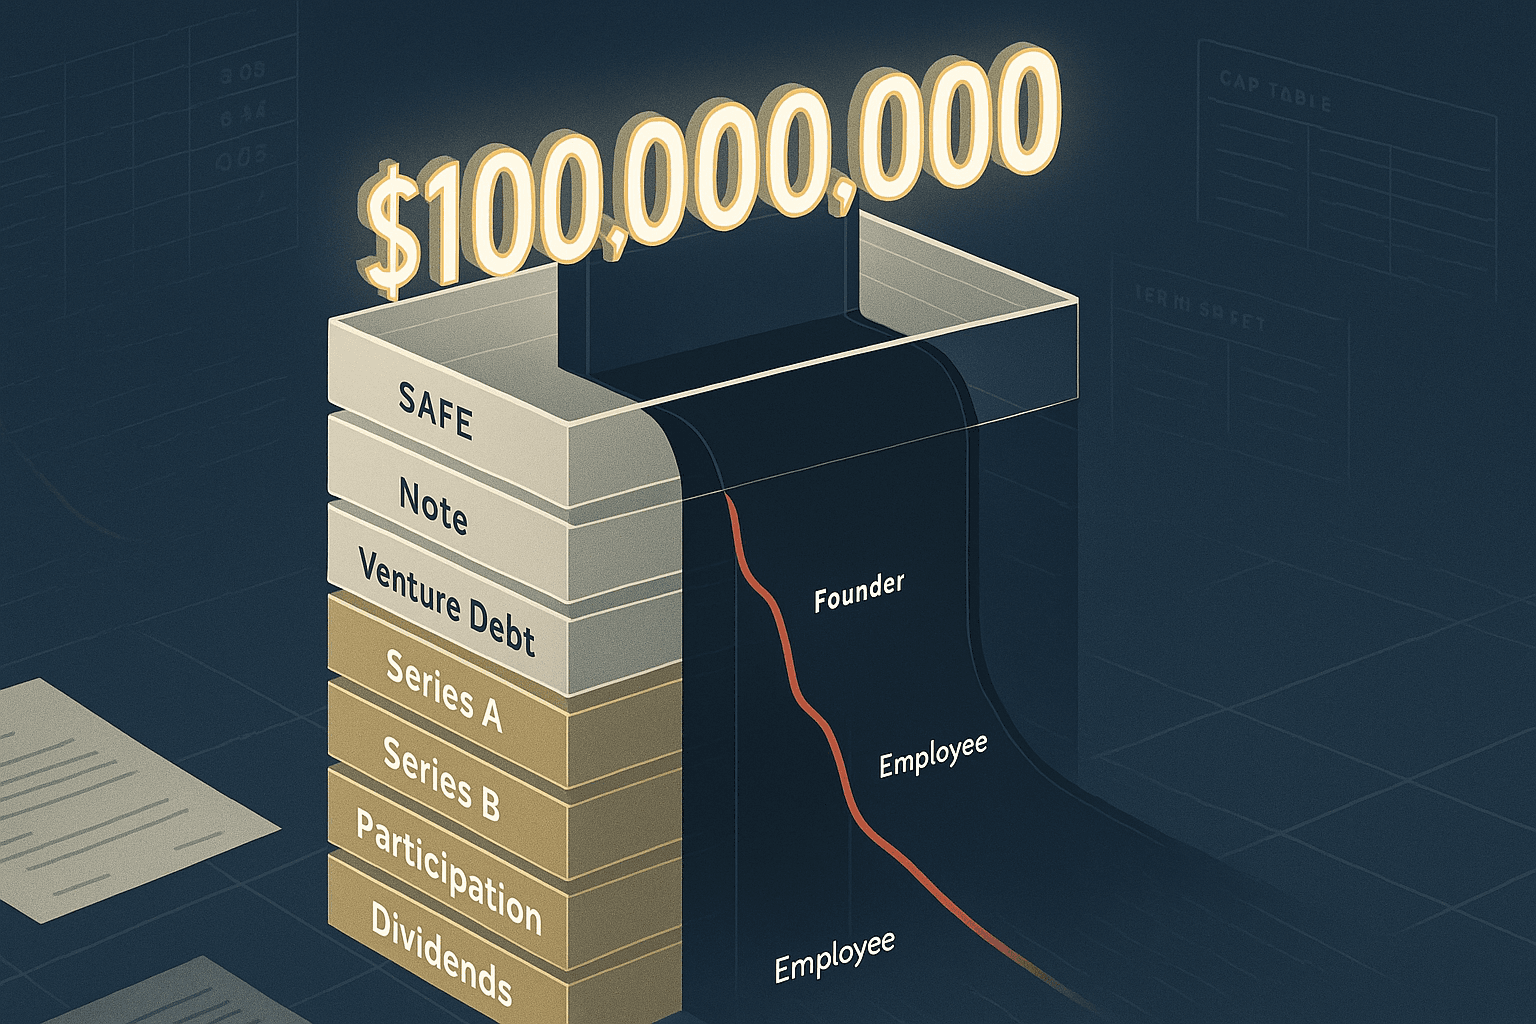
Why a higher valuation can produce a worse exit once liquidation preferences stack up, and how to compare term sheets by outcome, not headline.
The first offers a $60 million pre-money valuation with clean 1x non-participating preferred, no cumulative dividend, a modest option pool refresh, and no debt payoff surprises.
The second offers an $85 million pre-money valuation. The founder’s board lights up. Existing investors call it validation. Employees screenshot Carta and celebrate the markup. But buried in the docs are participating preferred for the new round, a cumulative dividend, a venture debt facility that must be repaid on change of control, stacked SAFEs converting on a shadow basis, and a pay-to-play structure that effectively hardens seniority for whoever keeps funding the company.
Eighteen months later the company sells for $140 million.
Under the “lower” valuation term sheet, founders and employees take home meaningful proceeds. Under the “higher” valuation term sheet, they discover the ugly truth: a bigger paper valuation created a worse economic outcome. Not slightly worse. Structurally worse.
This is the liquidation stack illusion. Founders are taught to optimize for headline valuation. In practice, valuation is only one variable in a much larger equation. Exit proceeds flow through a waterfall, and every preference, dividend, note discount, SAFE conversion mechanic, debt covenant, and seniority rule changes who gets paid first, how much comes off the top, and when common stock starts participating in the upside.
A company can raise at a “better” valuation and still make the founder’s expected outcome worse across a wide range of realistic exits.
That is not an edge case. It happens all the time in companies that stack multiple financings, use bridge instruments repeatedly, and negotiate on price while ignoring structure.
The problem: founders focus on ownership dilution and ignore distribution priority
Most founders know how to model dilution. Fewer know how to model payout priority.
They can tell you the difference between 20% dilution and 25% dilution. They often cannot tell you the difference between:
That gap matters because dilution tells you how the pie is divided if everyone shares pro rata. Liquidation terms determine whether common shareholders get to the pie at all.
At a $1 billion IPO, most of this may not matter much. At a $40 million, $80 million, or $150 million acquisition, the actual range where many venture-backed companies end up exiting, it matters enormously.
Founders consistently underestimate three things:
The result is predictable: teams celebrate valuation marks while accidentally moving the company into a zone where a decent exit produces weak common returns, weak employee retention, and broken incentives.
Why current approaches fail
1. Founders negotiate the visible number and ignore the hidden stack
The valuation is visible. The preference stack is hidden in legal language and waterfall math.
Boards present financings with a single headline: “We raised at $85 million pre.” That compresses a multidimensional economic trade into one socially legible metric. It is easy to repeat to employees, to the market, and to future investors.
But acquisition proceeds do not care about PR. They follow the stack.
2. Most cap table models stop at ownership, not exit outcomes
A standard cap table shows fully diluted ownership. It rarely shows:
That omission is not innocent. It pushes everyone toward valuation theater.
3. Investors often optimize downside protection while founders optimize optics
A high price plus stronger structure is a classic investor move. It protects downside while preserving upside optionality.
For investors, this can be rational. A fund can tell LPs it invested in a high-markup round while still building a strong claim on middling exits.
For founders, it is often a trap. If the company does not become a massive outlier, stronger investor terms can absorb a large share of exit value that the founder assumed belonged to common.
4. Bridge instruments create “shadow seniority” people do not model correctly
SAFEs and notes are often described as simple because they defer pricing. Economically, they can be anything but simple.
Depending on conversion mechanics, MFN clauses, liquidation rights, and whether they convert into shadow preferred with equivalent economics, bridge instruments can create a hidden class of claims that dilute common and sometimes piggyback on senior terms more aggressively than founders expect.
5. Venture debt is treated as non-dilutive, which is directionally false in exits
Debt may be less dilutive on paper at the time it is raised. But at exit, debt is senior cash leakage. Principal, accrued interest, end-of-term payments, fees, and sometimes prepayment penalties come off the top before equity sees proceeds.
If your likely exit range is not enormous, debt absolutely changes founder economics.
Core insight: the right metric is not valuation, but common proceeds across plausible exits
The clean way to evaluate a financing is not “What is the price?”
It is: Across realistic exit values over the next 24–48 months, what do founders, employees, and existing common actually receive under this term sheet versus the alternatives?
That means building a waterfall across a range of outcomes:
Then identify three critical thresholds:
If the financing raises the headline valuation but materially worsens those thresholds, it may be a bad deal for founders even if dilution looks better.
A practical framework for modeling the liquidation stack
Use this sequence.
Step 1: List every senior claim
Start with all obligations paid before common:
Do not mix these with diluted ownership yet. First map the hard claims.
Step 2: Define the preferred structure by round
For each round, note:
Step 3: Define conversion of SAFEs and notes
For each SAFE/note, specify:
This is where many models go wrong. “SAFE dilution” is not enough. You need the exact security into which it converts and the economics attached to it.
Step 4: Build the cap table only after the stack is mapped
Now calculate fully diluted ownership after all conversions and option pool changes.
Step 5: Run exit scenarios
For each exit value, distribute proceeds in order:
Step 6: Graph founder/common proceeds
The best output is not a table. It is a chart:
Overlay multiple financing structures. The ugly truth becomes obvious fast.
Scenario 1: lower valuation, cleaner terms vs higher valuation, dirty terms
Let’s use a realistic company.
Current company before new financing
Capital raised to date:
Fully diluted pre-financing ownership, assuming SAFE conversion in the next round, roughly:
The company needs another $15 million.
Term Sheet A: lower valuation, clean structure
Approximate post-financing ownership:
Total preferred capital stack:
Term Sheet B: higher valuation, worse structure
Approximate post-financing ownership might look superficially better than A because of higher price, but not by much after the larger pool and conversions:
The founder sees 35.0% instead of 33.6% and thinks they won.
That is the illusion.
What is actually senior to common under B?
First, debt payoff at exit if sold 18 months later:
Second, Series B-1 cumulative dividend over 18 months:
Third, shadow preferred for SAFE holders. Suppose their conversion economics produce an invested-equivalent liquidation claim of $6.5 million with same participating senior economics.
Then the stack before old preferred and common sees anything meaningful is:
That is before participation siphons additional value.
Compare that to the clean term sheet A with no debt, no dividend, no participation:
The “higher valuation” deal increased founder ownership by 1.4 points but increased senior overhang by $17.66 million plus participation drag.
That trade is often terrible.
Exit waterfall comparison
Now let’s compare outcomes at different exits. We will simplify taxes, fees, and working capital adjustments to isolate term effects.
Exit at $50 million
#### Term Sheet A
Total preferred claims are $31 million. Since all rounds are 1x non-participating and pari passu, preferred take preference because conversion would be worth less.
Residual for common:
Common-equivalent holders here are founders, employees, and anyone not taking preference. To simplify, assume only founders and employees effectively receive residual common value because preferred stay in preference.
Founder proceeds roughly:
Even after preferences, common still sees real money.
#### Term Sheet B
Start with debt payoff:
Now senior preferred stack begins absorbing value:
And because B-1 and shadow preferred are participating, they continue sharing in the residual.
At this exit level, common is nearly wiped out. Founders and employees together are splitting something close to de minimis proceeds after participating classes take their pro rata share of the final residual.
Founder proceeds may land around $0.8 million–$1.2 million, versus roughly $12.7 million under A.
That is not an academic difference. It changes whether the founder calls the exit acceptable or catastrophic.
Exit at $100 million
#### Term Sheet A
At $100 million, some or all preferred may still prefer liquidation preference rather than conversion depending on exact ownership and class rights, but the common residual is substantial.
Residual after preferences:
Founder proceeds using same rough common sharing logic:
Employee pool:
Even if certain classes convert, the broad point holds: common participates meaningfully.
#### Term Sheet B
Debt first:
Then base claims:
Now participation kicks in. B-1 and shadow SAFE holders share in residual based on as-converted ownership. Suppose together they own 23.5% of the company on an as-converted basis. They take another:
Residual left for everyone else:
Founder proceeds may be around $13 million–$16 million.
Remember: under A, founders were around $46 million on this simplified comparison. Under B, despite the higher valuation, they may earn less than one-third as much.
Exit at $200 million
This is where many founders say, “Fine, but if we execute, everyone wins.”
Maybe. But you need to check the crossover.
#### Term Sheet A
At $200 million, most preferred likely convert because pro rata ownership beats 1x preference. Founder proceeds approximate:
That is directionally correct once conversion dominates.
#### Term Sheet B
Debt still comes off first. Participating preferred may still be economically advantaged depending on no cap and dividend accrual.
Net after debt:
B-1 takes:
At this size, the drag is less devastating than at $50 million or $100 million, but still material. Founder proceeds might land around $50 million–$56 million, still below A.
Only at some larger exit, say $350 million+, depending on exact conversion mechanics, does the difference narrow enough that headline valuation starts to matter more than structure.
The lesson: if your actual exit distribution has a lot of probability mass below that crossover point, the “better” valuation is economically worse.
Scenario 2: stacked rounds and poisoned incentives
The deeper danger is not one dirty round. It is accumulation.
Consider this financing history:
Total cash invested/owed is now roughly:
Suppose the company’s realistic sale range is $60 million to $120 million.
That means a huge fraction of probable outcomes are being divided mainly among senior claimants.
This is where incentive poisoning starts.
What preference overhang does inside a company
When employees realize their options are unlikely to pay in any non-home-run exit, retention weakens. When founders see that a respectable acquisition barely clears the stack, they rationally reject medium outcomes and swing for variance. Boards then complain that management has become unrealistic about M&A.
No. The cap table made them realistic.
If a $90 million sale produces negligible founder/common proceeds, management is not incentivized to sell at $90 million. They are incentivized to gamble for $300 million, even if the probability-adjusted outcome is worse for the company as a whole.
That is how preference overhang poisons governance. Different stakeholders begin maximizing different payoff curves.
A useful heuristic: the common incentive zone
Define a “common incentive zone” as exit values where founders plus employees together receive enough proceeds for a sale to feel economically meaningful.
For many venture-backed startups, that threshold is not philosophical. It is concrete.
If founders together need at least $15 million post-tax to view a sale as life-changing, and key employees collectively need $10 million for retention and morale credibility, then common probably needs at least $25 million–$35 million pre-tax at exit.
Model where that happens.
If common does not get there until a $180 million exit, but the company’s likely market clearing M&A range is $80 million–$140 million, your financing structure is misaligned with reality.
Term sheet comparison: what founders should trade away and what they should not
Founders routinely overpay for valuation with terms because they fear “down signaling” or dilution optics.
That is backwards.
Here is the hierarchy.
Usually worth giving up
Dangerous to give up
If someone offers you 20% higher valuation in exchange for participating preferred and cumulative dividends, the default answer should be no until the waterfall proves otherwise.
Negotiation scenarios that preserve real upside
Here is how to negotiate like someone optimizing economics, not optics.
Scenario A: investor insists on participation
Do not argue in the abstract. Bring the waterfall.
Say:
“At a $100 million sale, this participating structure reduces common proceeds by approximately $25 million versus non-participating. If downside protection is the concern, let’s solve that with price or a modest seniority adjustment rather than an uncapped double dip.”
Alternatives to propose:
Scenario B: investor wants cumulative dividends
Your response:
“If this is growth equity in disguise, we should price it honestly. In venture, cumulative dividends mainly tax middling exits and distort incentives. We can discuss valuation, board rights, or milestone tranching instead.”
If you must concede, limit the damage:
Scenario C: venture debt looks attractive because it is “non-dilutive”
Ask one question:
“What does this do to founder/common proceeds at our 25th, 50th, and 75th percentile exit cases?”
If adding $10 million of debt improves runway but wipes out common in a $70 million–$100 million exit, it is not non-dilutive in any practical sense.
Possible fixes:
Scenario D: stacked SAFEs and notes are creating shadow seniority
Negotiate explicit conversion treatment:
Scenario E: existing investors push for senior insider bridge terms
This is common in hard financings. Insiders know the company best and often demand protection.
Founders should focus on preserving future M&A optionality:
How to identify when preference overhang is becoming dangerous
There is no single magic ratio, but these are useful warning signs.
Warning sign 1: senior claims exceed 40%–60% of plausible base-case exit value
If total debt plus liquidation claims are $50 million and the realistic sale range is around $80 million–$120 million, common is in the danger zone.
Warning sign 2: founders and employees receive little at exits the board would otherwise accept
If a credible strategic bid at $90 million yields less than, say, $10 million aggregate to common, expect misalignment.
Warning sign 3: new rounds improve valuation while worsening common proceeds in the most likely exits
This is the textbook liquidation stack illusion.
Warning sign 4: key employees no longer believe option value is real
Once that belief breaks, the company’s compensation system weakens.
Warning sign 5: M&A discussions repeatedly fail because management and investor incentives diverge
Often the culprit is not ego. It is the waterfall.
A simple founder checklist before signing any round
Before you accept a term sheet, ask for a scenario model showing at minimum:
Then ask two blunt questions:
If the answer to the second question is no, you are financing into an incentive problem.
The contrarian conclusion
A higher valuation is not inherently better. In venture, price without context is a vanity metric.
The economically relevant question is whether the financing increases or decreases realizable common value across plausible exits.
That is why experienced founders sometimes choose the lower-priced round. Not because they enjoy dilution. Because they understand that the value of common stock depends less on the screenshot valuation and more on the shape of the liquidation waterfall.
A clean $60 million pre with simple 1x non-participating preferred can easily beat a flashy $85 million pre saddled with participation, dividends, debt, and shadow seniority.
If your company exits at a massive outcome, many of these terms fade into the background. But most financing decisions are not made under certainty of a massive outcome. They are made under a distribution of possibilities, many of them mediocre, some of them good, few of them extraordinary.
That is exactly where structure matters most.
Founders who ignore the stack are not being optimistic. They are outsourcing economics to legal fine print.
The disciplined move is simple:
In short: stop negotiating for marks. Start negotiating for money you can actually keep.
That is the difference between winning the round and winning the outcome.
RaiseSimpli Team
Author